
By Jeremy Rhodes
The first wave of data releases from the 2020 US Census is here, and many of the demographic shifts that we’ve seen across the country and the state are mirrored in our Waco community. In this series of posts, I am presenting some of the demographic changes we see in McLennan County from 2010 to 2020.
The first post presented numbers regarding general population growth and decline. The second post showed an overview of racial and ethnic changes in the county. The third post expanded on the racial/ethnic changes in McLennan County since 2010. In this post, we will look at some of the changes to the housing landscape in Waco since 2010.
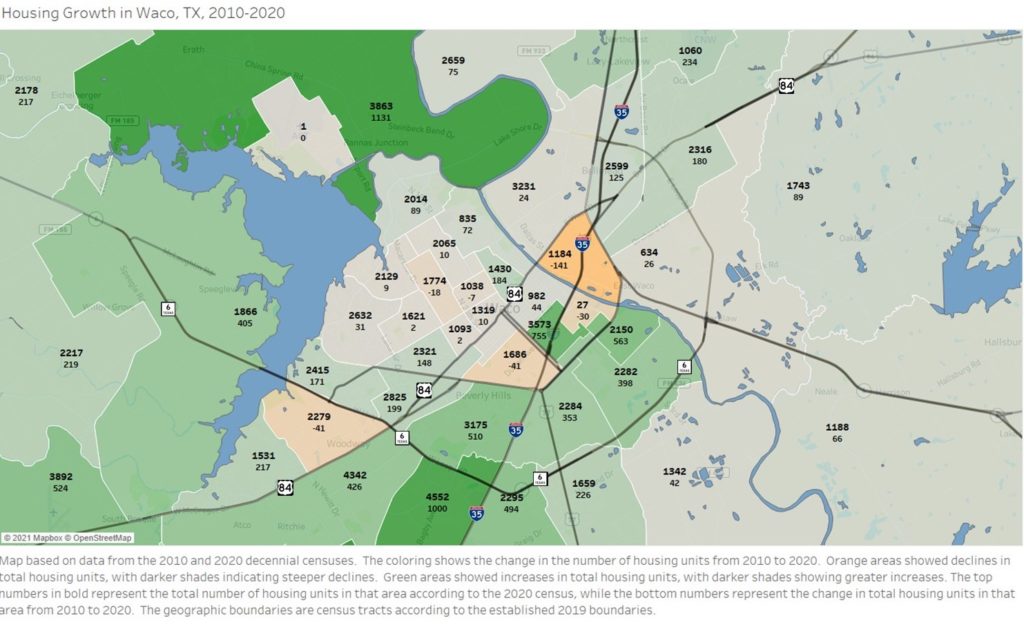
This first map shows the number of housing units in each area, as well as the change in housing units since 2010. The orange areas saw a decline in total housing units, with darker shades indicating a larger decline. The green areas saw an increase in total housing units, with darker shades indicating a larger increase. The top number shows the total number of housing units in that area, while the bottom number shows the change in number of housing units since 2010.
Most of central Waco and north Waco saw little change in total number of housing units from 2010 to 2020. The largest growth in housing units was seen in China Spring, with an addition of 1131 housing units, and Hewitt, with an addition of 1,000 units. Only six census tracts saw declines in the number of housing units since 2010. One of the historic East Waco tracts (tract 15) saw the largest decline in housing units, with a loss of 141 households. Most of the county saw moderate to robust housing growth.
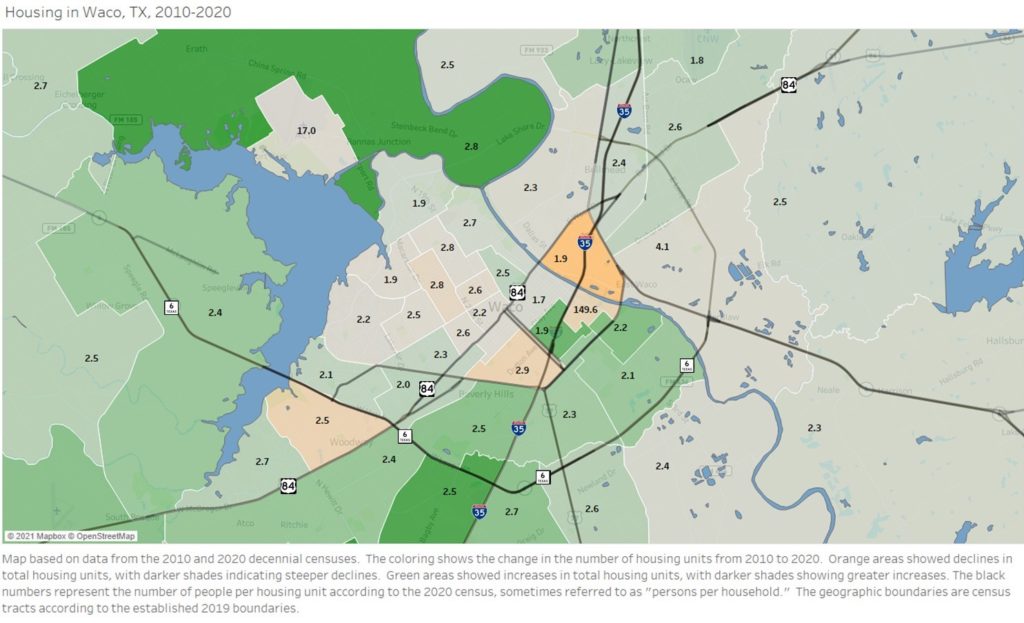
The second map is similar to the first. The coloring is the same, with green shades indicating growth in housing units since 2010, and orange shades indicating decline in housing units since 2010. The black number in each tract is different in this map; it displays the number of residents per household in that area. Most of the county has between two and three people per household. Notable exceptions include downtown Waco and historic East Waco, where there are fewer than two residents per housing unit.
There are two outlier tracts that should be explained. In the northwest of the map, you will see a tract with 17 people per household. That tract is the airport, and we should not think too much about housing and population data for that tract. The other outlier is the tract containing Baylor University, which has a “persons per household” of 149.6. Although the Census Bureau does not consider dorms to be housing units, I cannot be certain how they obtained such a high number while excluding dorms from consideration.
If you have any questions about this, or if you would like Jeremy to give an overview of these changes to your group, staff, or organization through Zoom or in person, please contact Jeremy Rhodes at [email protected].
Jeremy Rhodes, Ph.D., is director of research and community impact for Prosper Waco.
The Act Locally Waco blog publishes posts with a connection to these aspirations for Waco. If you are interested in writing for the Act Locally Waco Blog, please email Ferrell Foster at [email protected].
By Jeremy Rhodes
The first wave of data releases from the 2020 US Census is here, and many of the demographic shifts that we’ve seen across the country and the state are mirrored in our Waco community. In this series of posts, I will present some of the demographic changes we see in McLennan County from 2010 to 2020.
The first post presented numbers regarding general population growth and decline. The second post showed an overview of racial and ethnic changes in the county. This post will expand on the racial/ethnic changes in McLennan County since 2010.
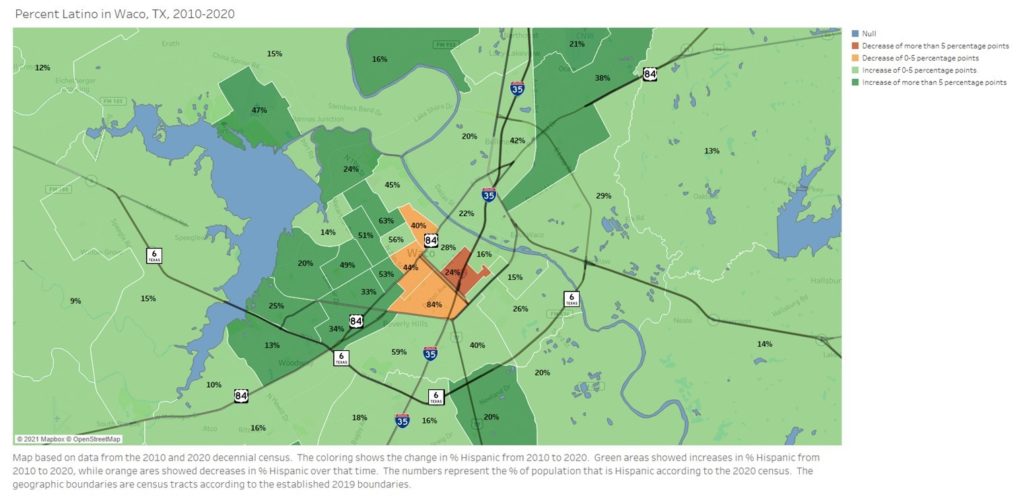
I made a series of maps that show us which parts of Waco have experienced growth and decline for some of the major racial and ethnic groups from 2010-2020, using census tract boundaries. For each of these maps, the orange areas showed decline for that group, while the green areas showed increases for that group. The black numbers represent the percentage of the residents in that tract who identify with that racial or ethnic group, according to 2020 census numbers.
As I mentioned in the previous post, the Census Bureau advises caution when comparing the racial and ethnic composition of 2010 to that of 2020. According to their website, “data comparisons between the 2020 Census and 2010 Census race data should be made with caution, taking into account the improvements we have made to the Hispanic origin and race questions and the ways we code what people tell us.”
The first map shows us Waco’s Latino population. Almost the entire map is green, indicating numerical growth in almost every census tract. “Percent Latino” declined in 4 census tracts, but increased everywhere else in the county. Even areas with a relatively small Latino population, such as China Spring, Speegleville, Woodway, and Hewitt, showed increases.
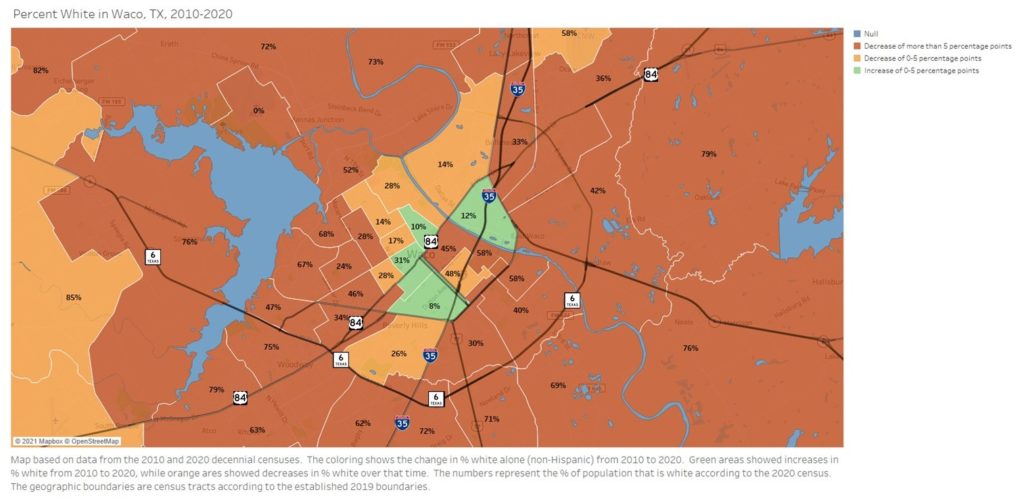
The next map shows Waco’s population who identify as White alone, non-Hispanic. It’s almost the complete opposite of the Hispanic map. Whereas the map of Latinos is almost entirely green, the map of Whites is almost entirely orange. Four census tracts in the interior of Waco show modest increases in percentage of the population that is White, but those are all tracts that already have a low percentage of Whites.
Everywhere else in the county shows declines in percentage of the population that is White. It should be noted that the orange areas do not necessarily represent a decline in the number of White people in that area, just a decline in the percentage of the population that is White. Many of the orange areas on each of these maps have more people in them from those groups, just a lower share of the population. It should also be noted that most of the orange areas on this map are a dark orange, indicating a decline of more than 5 percentage points since 2010.
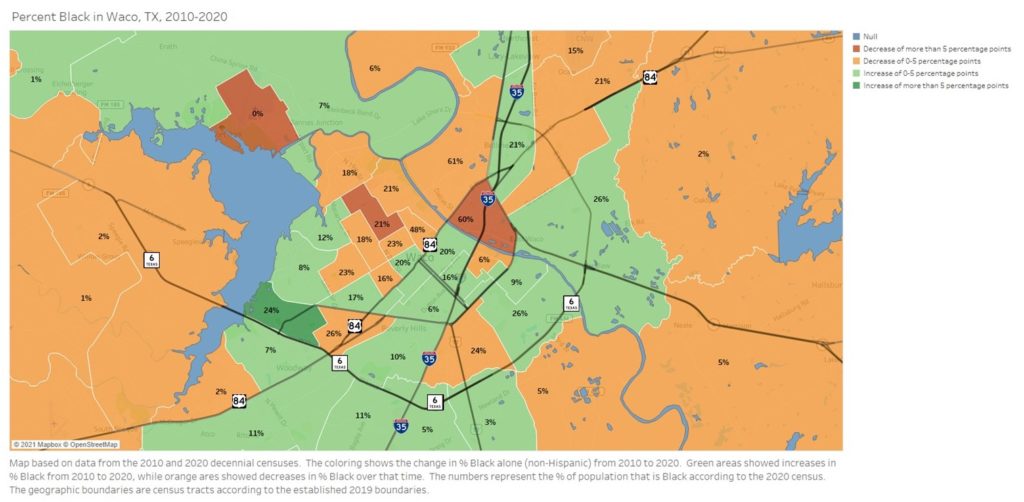
The next map shows the growth and distribution of Black residents in Waco who identify as only Black, non-Hispanic. Unlike the maps for Latinos and Whites, this map shows a mixed story. The tracts are split evenly between those that show growth in percentage Black and those that show decline. East Waco showed a decline in percentage Black, but these areas are still the places in Waco with the highest percentage of African Americans.
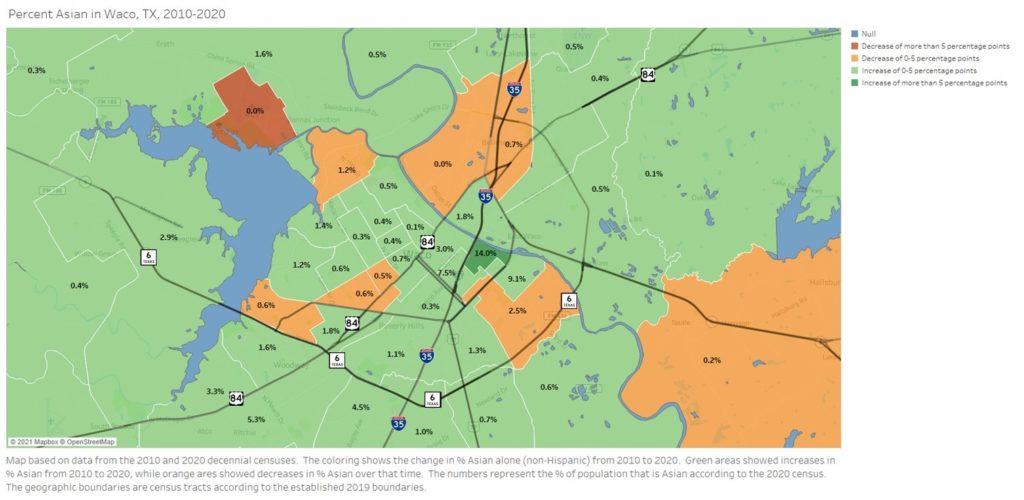
The next map shows the growth and distribution of Asians in Waco, which includes folks who identify with East Asian cultures such as those of China and Korea, Southeast Asian cultures such as those of Vietnam and Indonesia, and South Asian cultures such as those of India and Pakistan. Similar to the story for Latinos, most of Waco has seen an increase in the percentage of residents who identify as Asian. Most of the areas of Central Waco have seen modest increases in percent Asian, though the numbers remain small. In most Waco census tracts, less than 2% of the residents are Asian. The notable exceptions include areas near Baylor University, and the Hewitt/Woodway areas.
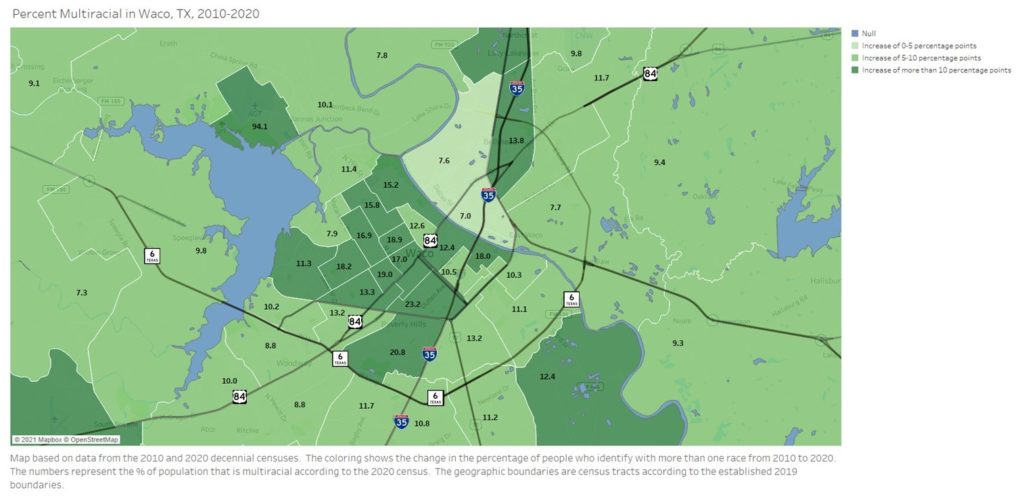
The final map shows the percentage of Waco residents who identify with more than one racial identity. All areas have shown growth, and the shade of green shows the amount of growth for that census tract. The areas with the darkest shade of green, mostly within the city limits, have each seen increases of at least 10 percentage points. As I mentioned in the previous post, the increase in multiracial people is caused by 3 reasons.
- Improvements in the census questions allow for a more accurate count
- Reduced stigma for interracial couples has led to more pairings, and more biracial children
- Interracial people are more willing to identify as such than in the past
If you have any questions about this, or if you would like Jeremy to give an overview of these changes to your group, staff, or organization through Zoom or in person, please contact Jeremy Rhodes at [email protected].
Jeremy Rhodes, Ph.D., is director of research and community impact for Prosper Waco.
The Act Locally Waco blog publishes posts with a connection to these aspirations for Waco. If you are interested in writing for the Act Locally Waco Blog, please email Ferrell Foster at [email protected].
By Jeremy Rhodes
The first wave of data released from the 2020 US Census is here, and many of the demographic shifts that we’ve seen across the country and the state are mirrored in our Waco community. In this series of posts, I am presenting some of the demographic changes we see in our county from 2010 to 2020. The first post presented numbers regarding general population growth and decline. This second post will show an overview of racial and ethnic changes in the county.
The census website advises caution when comparing the racial and ethnic composition of 2010 to that of 2020. According to their website, “data comparisons between the 2020 Census and 2010 Census race data should be made with caution, taking into account the improvements we have made to the Hispanic origin and race questions and the ways we code what people tell us.”
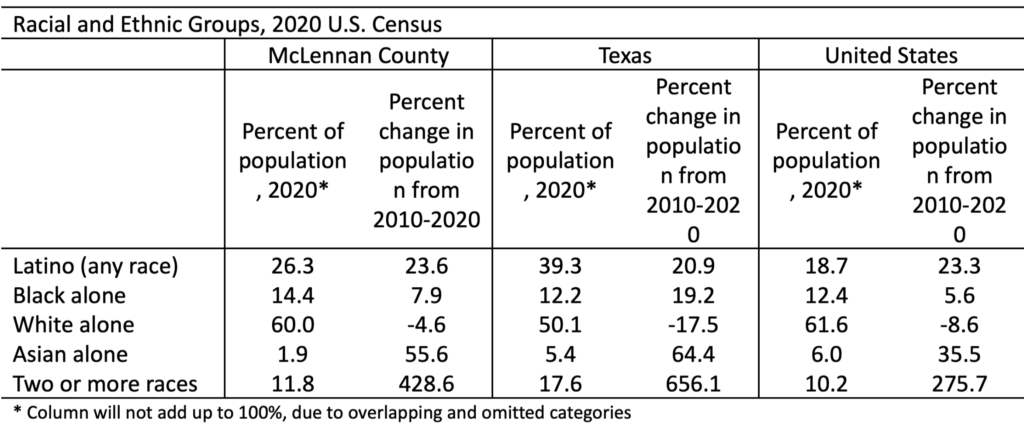
With that caveat in mind, from 2010 to 2020, the U.S. saw the most dramatic growth among two racial and ethnic groups: Latinos and multiracial people. The U.S. saw a 23% increase in Latinos, while the state of Texas saw a 21% increase in Latinos. In McLennan County, the Latino population increased by 23.6%, or an addition of 13,116 people. Multiracial Americans also saw significant growth throughout much of the United States. In McLennan County, multiracial people now make up 11.8% of the population, which is an increase of 428.6%.
The following table shows a more detailed racial and ethnic makeup for the county, in comparison to Texas and the entire U.S.
The tremendous growth of multiracial people is caused by multiple factors. The most obvious factor has to do with lessening stigma against interracial relationships. As we come to see more and more interracial pairings, we will have more biracial children being born.
Second, the Census Bureau has improved the way they ask the race/ethnicity question by creating two separate questions for race and ethnicity, which experts believe will provide a more accurate portrait of how people identify (this change is expected to also improve our count of Latinos in America).
Third, there is evidence that multiracial individuals are more willing to identify as such than in the past. For example, a person who has one Black parent and one Latino parent is now less likely to choose between those two identities, and more likely to identify as both.
The next post in this series will display maps that show where we have seen the growth and decline for specific racial/ethnic groups in Waco. If you have any questions about this, or if you would like Jeremy to give an overview of these changes to your group, staff, or organization through Zoom or in person, please contact Jeremy Rhodes at [email protected].

Jeremy Rhodes, Ph.D., is director of research and community impact for Prosper Waco.
The Act Locally Waco blog publishes posts with a connection to these aspirations for Waco. If you are interested in writing for the Act Locally Waco Blog, please email Ferrell Foster at [email protected].
By Jeremy Rhodes
The first wave of data releases from the 2020 US Census is here, and many of the demographic shifts that we’ve seen across the country and the state are mirrored in our Waco community. In this series of four posts, I will present some of the demographic changes we see in McLennan County from 2010 to 2020. This first post will be an overview of the changes in the data reported by the U.S. Census Bureau.
In all, McLennan County saw an increase of 10.9% from 2010 to 2020. The county added an additional 25,673 residents, with a 2020 population of 260,579. Of the McLennan County residents, 53.1%, or 138,486 people, live in the city of Waco. This rate of growth is lower than the Texas growth rate of 15.9%, but higher than the total U.S growth rate of 7.4%.
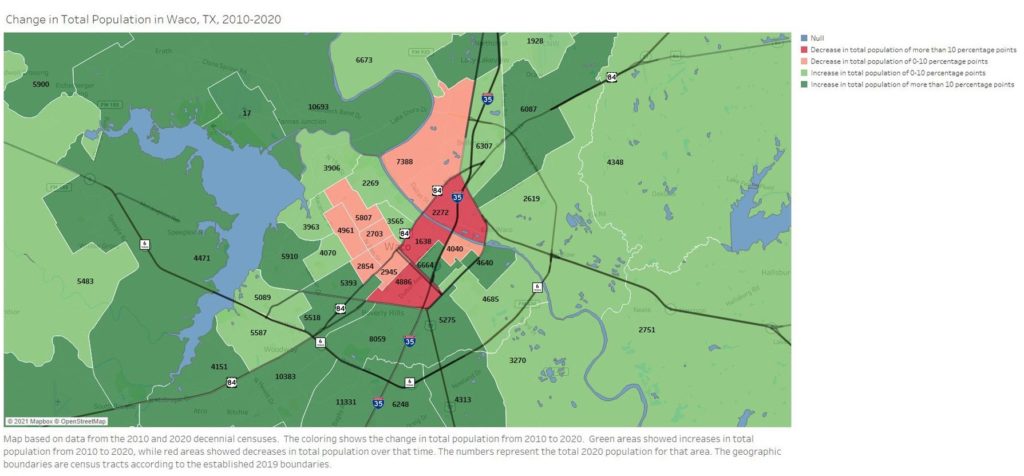
The map shows where we saw growth and decline in McLennan County from 2010-2020. The coloring shows the change in total population. Green areas showed increases in total population, while red areas showed decreases. The numbers represent the total 2020 population for that area. The geographic boundaries are census tracts according to the established 2019 boundaries.
The highest growth rates appear along the outskirts of the Waco city limits, in communities such as China Spring, Speegleville, Woodway, Hewitt, Robinson, and Bellmead. Areas that saw population decline over this time include East Waco, downtown Waco, and the 10 to 15 blocks on either side of the 25th/26th St. corridor, running from I-35 in the southeast to Park Lake Dr. in North Waco. Those areas are also characterized by lower populations than the rest of the city.
In the next posts, we will begin exploring the changing racial and ethnic dynamics of McLennan County. If you have any questions about this, or if you would like Jeremy to give an overview of these changes to your group, staff, or organization through Zoom or in person, please contact Jeremy Rhodes at [email protected].
Jeremy Rhodes, Ph.D., is director of research and community impact for Prosper Waco.
The Act Locally Waco blog publishes posts with a connection to these aspirations for Waco. If you are interested in writing for the Act Locally Waco Blog, please email Ferrell Foster at [email protected].

By Jeremy Rhodes
My family and I are trying to buy a house here in Waco. In case you haven’t heard, that’s hard to do right now. Luckily, we have some generous friends who are allowing us to crash at their place for a few weeks while we get things ironed out.
We have made an offer on seven houses. (I think?… My wife would know for sure.) For at least two of the houses, we know we were the highest bid, but we lost out to some cash offers.
The recent decision of our city council to limit short-term rentals should help the supply of housing for sale, but the impact of that change might not be felt for a while. For now, we are left at the mercy of sellers who we can only hope will see some value in our offers and take mercy on a family trying to finance their home.
Increasing home prices can have ripple effects on rental prices, as well. As my wife and I consider the possibility that we may have to rent for a few months and try to ride out this real estate wave, we are realizing that the cost of renting is rising along with the cost of buying. In some cases, the cost of renting is as high as the cost of a mortgage, but without the benefit of building equity on an asset.
I imagine this squeeze is being felt especially hard for first-time home buyers, especially those who are looking for low-cost homes to buy. About once or twice a week, I hear rumors of West-Coast investors paying cash to snatch up homes to flip, but I’m not sure how or whether those rumors can be verified. The current difficulty of our housing market has more to do with the current low supply of homes for sale than with a surplus of potential buyers.
So please sell me your house, but only if it’s a house I’ll like. We’re not currently in the market for houses we don’t like.

Jeremy Rhodes is director of research and community impact for Prosper Waco.
The Act Locally Waco blog publishes posts with a connection to these aspirations for Waco. If you are interested in writing for the Act Locally Waco Blog, please email Ferrell Foster at [email protected].